A residual stress map is a 2D diagram or image showing stress levels on or within a part, and is useful for understanding how a product will deform over time, under load and during manufacture. It can highlight regions at high risk of fatigue in service, show how welding and machining might lead to deformation, and validate the impact of processes intended to put compressive stress into the surface.
Just as multiple methods exist for measuring residual stress, there are several ways to perform residual stress mapping, including contour mapping, heat maps, FEA plots, and X-ray diffraction.
Table of Contents
Contour Mapping
This destructive technique involves cutting a part along the plane of interest. Compressive and tensile stresses make the newly revealed surface deform, and this is measured with a high-resolution scanning system. FEA is then used to determine the forces needed to push the surface back to a perfectly flat state, and the resulting information is then displayed as charts of compressive and tensile residual stress.
The process can be applied to large parts and those that have undergone processes such as welding. However, its disadvantages include:
- New stress and levels of uncertainty due to sectioning. Wire EDM is the most effective method of sectioning, but only for electrically conductive materials.
- It’s not good for applications requiring sample preservation.
- Sectioning multiple parts may be required to understand residual stress throughout a large and complex design.
Heat Maps
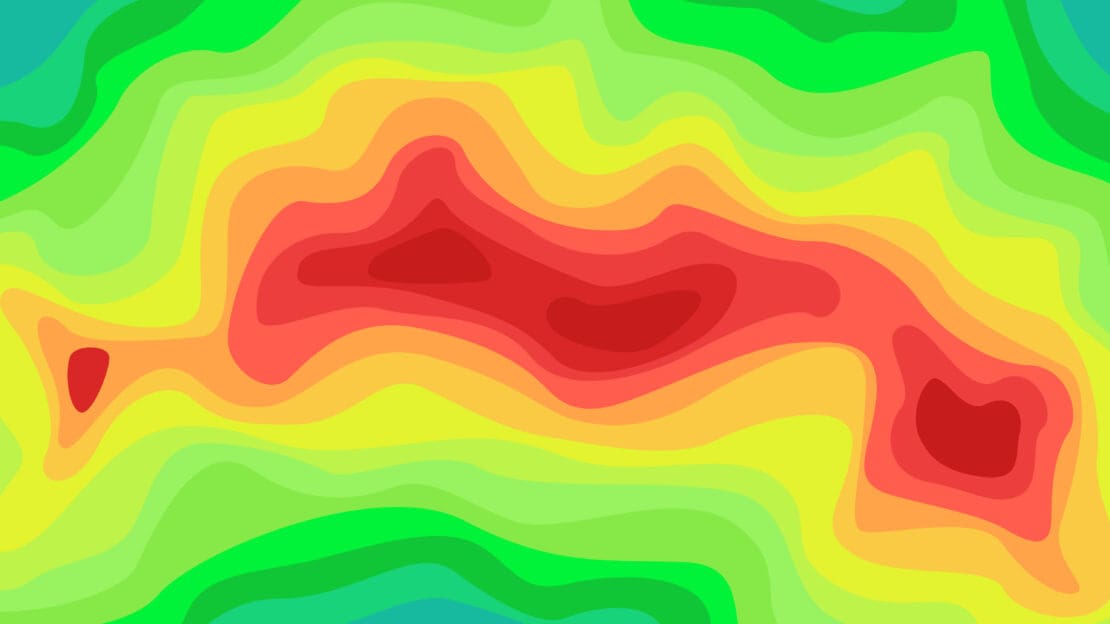
Heat maps use material hardness as an indicator of residual stress. The idea is that compressive and tensile residual stress at or near the surface increases or decreases the resistance to indentation. So, by taking hardness readings at select points across a surface, it’s possible to create a map showing higher and lower levels.
In principle, it’s a straightforward approach, but one that has some limitations:
- Material hardness can vary for reasons besides residual stress.
- They have relatively low resolution, so it can be challenging to identify smaller-scale patterns, hotspots, or anomalies.
- Can be considered destructive because you permanently lose information when you downsample high-resolution data.
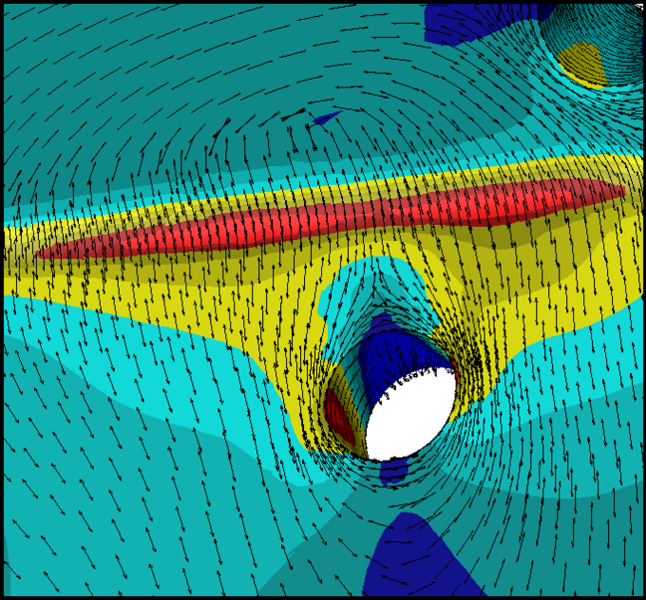
FEA Plots

Finite Element Analysis (FEA) is a method of predicting residual stress levels rather than measuring those actually present. It entails:
- Creating a very accurate model of the part to be made, with all relevant material properties included.
- Applying a load, as is anticipated during production or in service (e.g., thermal changes due to welding, structural loads, etc.).
- Removing the load.
- Determining the stress levels remaining in each cell.
While useful for determining areas that may be most susceptible to residual stress, the limitations of FEA plots include:
- Insufficient resolution, especially for calculating and displaying surface residual stresses.
- Vulnerable to any errors or omissions in material properties.
- Not good at incorporating local material and dimensional variations.
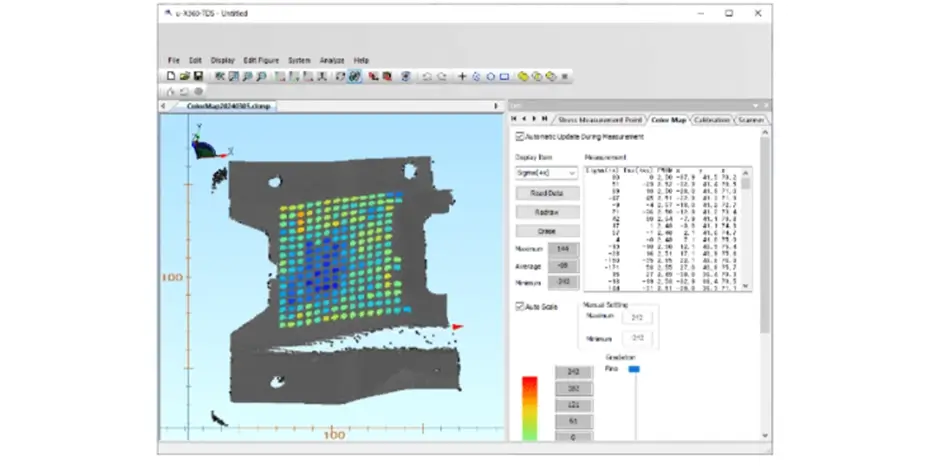
XRD
Residual stress distorts the crystal lattice of a structure. This can be seen by projecting an X-ray beam into the material and observing how it is diffracted.
Earlier versions of this X-ray diffraction (XRD) method viewed the diffracted beam in only a single position. More recently, it has become feasible to view the entire Debye-Scherrer ring using the cosα method, which provides a very clear view of the structure and has been shown to be an accurate, repeatable and faster way of determining residual stress.
The primary advantages of XRD are that it’s non-destructive, fast, accurate, and can be used to obtain additional information about the surface, such as hardness.
XRD’s primary limitation is that it’s only ideal for surface stress measurements. Viewing internal residual stress requires sectioning.
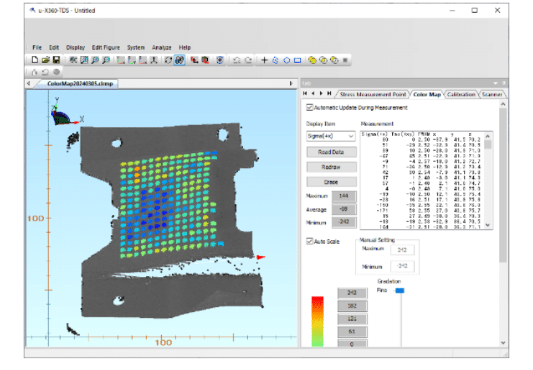
See If Pulstec’s Solution Is the Right Product for You
Founded in 1969, Pulstec produces high-precision X-ray measurement and analysis equipment for laboratory and industrial use, including our Robotic Residual Stress Mapping System, which features our original μ-X360s residual stress analyzer and a 3D scanner. The system is designed to quickly and accurately build a residual stress map over time, even with large or complex parts. It also supports 1-axis, 3-axis, and planar slide oscillations, features automatic mapping, and doesn’t require antihalation spray.
If you’re interested in learning more about our system and how it can help you area map residual stress, contact us today to request a free demonstration.