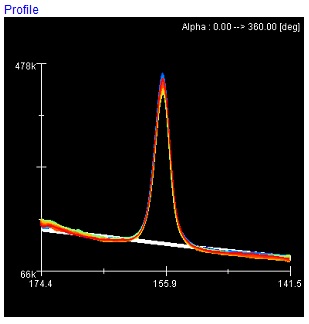
Full width at half maximum, more commonly known as FWHM, is a statistical measure used to describe the width of a normal distribution or Gaussian distribution. Specifically, it represents the width of a curve measured between the two points where the curve’s value is half its maximum.
In simpler terms, if you were to take the maximum value of a distribution and divide it in half, the width between the two points on the distribution curve corresponding to this “half maximum value” is your FWHM measurement.
FWHM Meaning
What Is FWHM Used For?
FWHM is a valuable tool to characterize and analyze various functions, such as pulse waveforms, the spectral width of light sources, and the resolution capabilities of spectrometers.
Some direct applications of FWHM Include:
Residual Stress Measurement Using XRD
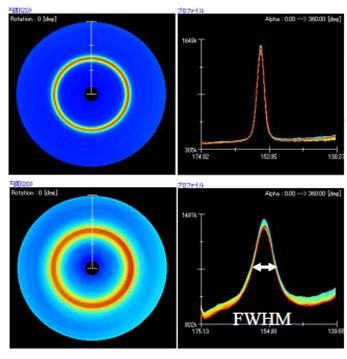
X-ray diffraction (XRD) is a powerful technique that can be used to measure residual stresses in materials. When a material is processed by mechanical processing or heat treatment, it can change internal stresses, grain size, dislocation density and micro-distortions. The processing can also change the spacing between the planes of atoms in the crystal lattice, which means that when X-rays are diffracted off these planes, the diffraction pattern (specifically the diffraction peak) can shift and also change in width. The shift is used for stress calculations, and the width change is used for property analysis of materials.
Optics
In laser physics and optics, FWHM is often used to define the width of a laser beam or the spectral width of light sources. For instance, when measuring the sharpness of spectral lines, the FWHM value indicates how “broad” or “narrow” a spectral line is.
Signal Processing
In signal processing, the FWHM of a signal can provide insights into the signal’s time duration or spectral bandwidth.
Medical Imaging
In fields like MRI or PET scanning, FWHM is used to determine the resolution of the image. A smaller FWHM often indicates a sharper image, while a larger FWHM suggests a blurrier image.
Radio Astronomy
When examining sources in the sky, the FWHM of an observed beam can provide information about the size and shape of distant astronomical sources.
There’s no question that full width at half maximum is a robust and significant analytical tool in applications ranging from optics to material sciences—it can provide meaningful insights into both material properties and signal characteristics.
Surface Hardness Using FWHM
When evaluating the hardness of materials, metallurgists often turn to techniques such as Rockwell Hardness Testing and Vickers Hardness Testing.
These methods of determining surface hardness have been standard practice, with the Rockwell test being the most common due to its simplicity. However, while both tests are highly effective, they have a notable downside. The Rockwell and Vickers Hardness tests require direct contact with the material in question, which means they can be destructive.
Destructive measurements require advanced planning and preparation, resulting in growing expenses and risks, especially when testing a production part with tight tolerances and stringent quality standards.
This is where the full width at half maximum (FWHM) comes into the picture. FWHM is calculated from X-ray diffraction (XRD) data.
By taking non-destructive, non-contact XRD measurements and calculating FWHM information from that data, it’s possible to speed up surface hardness measurements and reduce costs significantly. Furthermore, non-contact XRD measurement makes it easy to extend the measurement area. With a robot, X-Y stage, or rotation stage, you can easily create a high-resolution hardness map, which is impossible with conventional methods like Rockwell and Vickers.
The Correlation Between FWHM & Surface Hardness
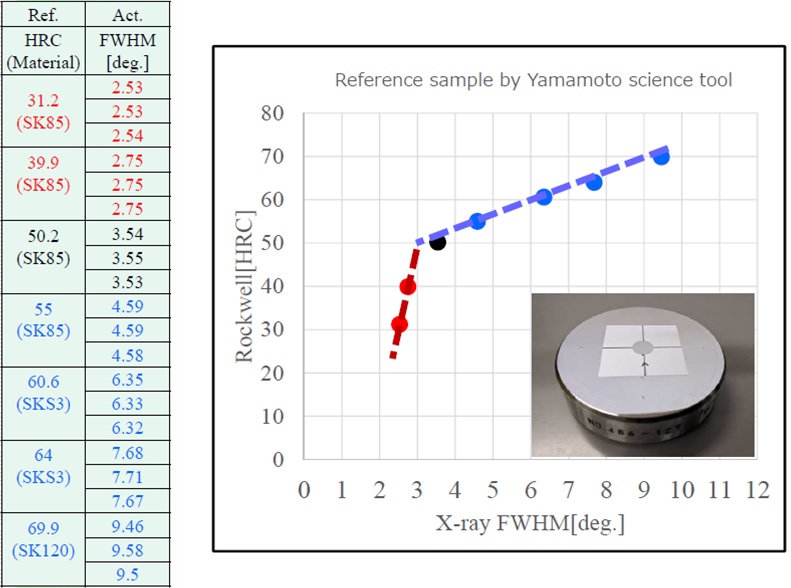
This relationship between FWHM and surface hardness can be described as follows:
- The grain refinement, processed by shotpeening or heat treatment, can increase surface hardness and is linked to a rise in the FWHM value measured in degrees.
- The martensite-transformation of a material like SK85 tool steel, for instance, can change hardness. These changes are reflected in an increased FWHM value.
- Transformations like dislocation density and elongation of grains are also associated with changes in surface hardness, thus affecting FWHM.
- If Debye Scherrer ring data is measured in 0.72-degree steps and averaged out over the dataset, it’s possible to perform highly repeatable measurements.
Understanding the relationship between FWHM and surface hardness not only improves our overall ability to characterize materials but also paves the way for more accurate and precise non-destructive testing techniques. In an industry where innovative solutions are constantly sought after, this association is incredibly promising for the future of material testing.
How Do You Determine FWHM?
To determine the FWHM of a distribution:
- Identify the maximum value of the distribution.
- Take half of this maximum value.
- Find the two curve points corresponding to this half maximum value.
- Measure the width between these two points—this is the FWHM.
Learn More From Pulstec
Founded in 1969, Pulstec is a trusted, innovative manufacturer of electronic equipment, including the muraR Surface Hardness Variation Scanner. This non-contact scanner calibrates the full width at half maximum obtained from hardness reference specimens and X-ray diffraction.
Please visit our resource library to learn more about FWHM, or contact us today to schedule a demonstration of our muraR hardness variation scanner.