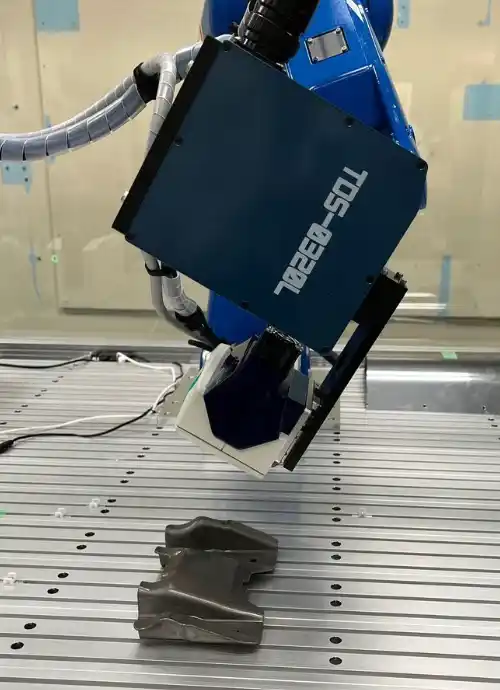
X-ray diffraction is a highly effective way to measure surface-level residual stress in crystalline materials. However, it can be difficult to interpret data from a single spot result. Area mapping is one way to overcome this challenge. Area mapping transforms this data into a visual format that’s easier to interpret. Different stress levels are represented by various colors, making it easier to identify polarity, compressive or tensile residual stress, and high-, medium-, and low-stress level areas within a sample.
Color maps can also be used to compare residual stress distributions before and after processes like machining, welding, or heat treatment, which is vital for assessing the effectiveness of these stress-relief procedures.
Pulstec understood the need for area mapping and developed an advanced XRD system with three components: a robotic arm, an X-ray stress analyzer, and a 3D laser scanner.
Table of Contents
How Our System Works
The system’s 3D laser scanner (attached to the robotic arm) scans the sample, capturing its surface geometry. The 3D laser scanner uses the triangulation method, which gives it the ability to detect the sample surface’s reflection at different angles, helping it calculate the precise topography of the surface. The triangulation method also ensures the measurements are taken consistently and accurately, as the system takes into account the exact orientation and position of the sample’s surface. After scanning, the point clouds are displayed on the PC as a visual 3D image. The stress mapping resolution, or measurement pitch, is programmable. Users can drag select areas within the image to indicate where stress mapping should occur. Once the areas are set, the software moves the X-ray stress analyzer spot-to-spot in the area until completed, and shows areas of residual stress level with polarity as a color map.
Features & Benefits
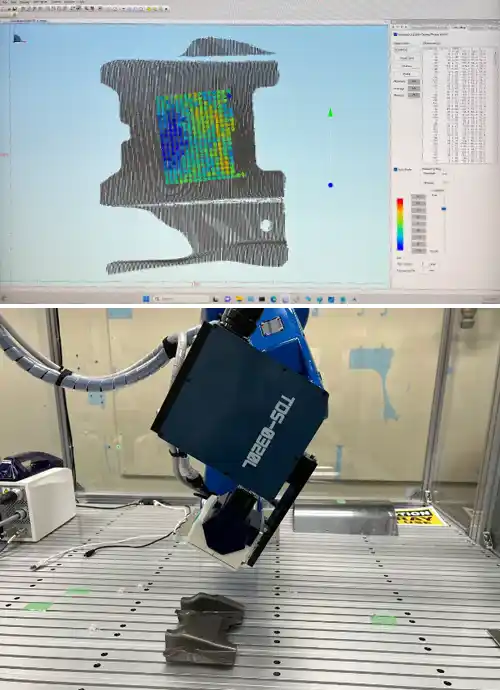
- Works for Large Samples: Our system can scan areas up to 300 x 300 millimeters, making it an exceptional option for measuring larger samples.
- Measures Complex Surfaces: The 3D laser scanner uses the triangulation method, allowing it to scan complex geometries, including curved surfaces.
- Manual Mapping: You can manually input various start positions, meaning you can tell the robotic arm which areas to scan rather than have it scan the entire surface area.
- Angle & Plane Oscillation: Our system supports planar slide oscillations, along with X-Y. X-Θ, or Y-Θ movements, which help capture a broader range of data from different orientations and reduce potential errors caused by uneven surface texture or grain coarsening properties of the material.
- Out-of-Plane Element Cancellation: The software supports out-of-plane element cancellation to isolate and accurately measure specific in-plane and shear residual stresses within a material without influences from out-of-plane elements.
- Simulation: Before starting operational tests or measurements, you can use the software to display a Debye-Scherrer ring simulation of the measurement area, which can help you confirm if all spots result in a complete diffraction ring.
- Easy-to-Ready Results: Our software automatically displays all data in an easy-to-read color map. You can toggle different areas of the map to view specific data points.
- No Antihalation Spray Needed: Little preparation is needed when using our system. Because our 3D laser scanner has an automatic power control function, you don’t need antihalation spray to maintain clarity and ensure measurement accuracy.
Using Our System
Our system is straightforward and requires very little training. Follow these steps to successfully create a 3D color map:
1. Launch the Software
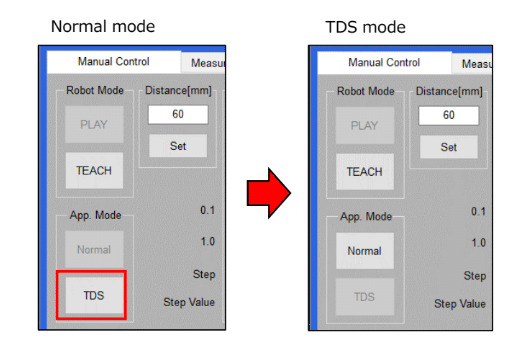
Launch the software and use the ‘Connection’ settings to establish a link between your computer and the robot. Then, select a measurement mode. To use the robotic arm with the laser scanner, you’ll want to select ‘TDS mode’(3D scanning mode) instead of ‘Normal mode.’ After selecting this, the 3D scan mapping software will launch. Ensure you have already inputted a license key.
2. Set the Sample
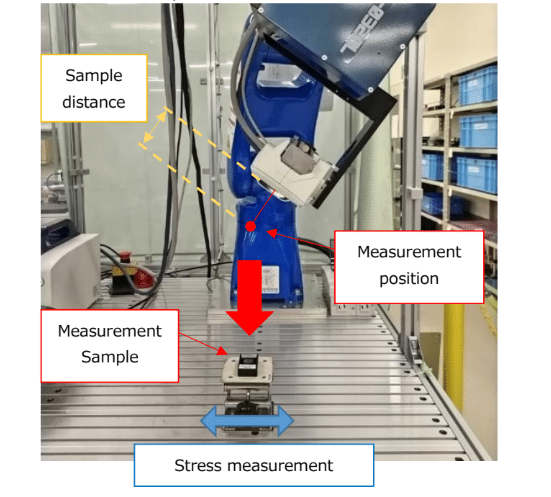
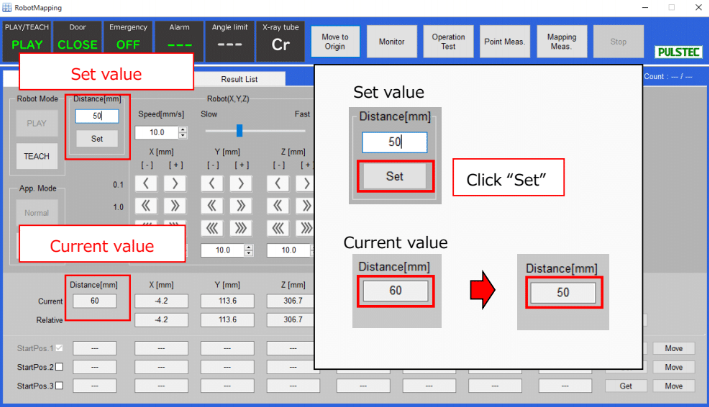
Place the sample that you want to be measured near the center inside the shielded box or at the center of the rotating stage, depending on which model you have. Place the sensor unit under the sensor head at the origin position to ensure easier adjustments. Set the sample distance to 60 millimeters.
3. Configure the Measurement Conditions
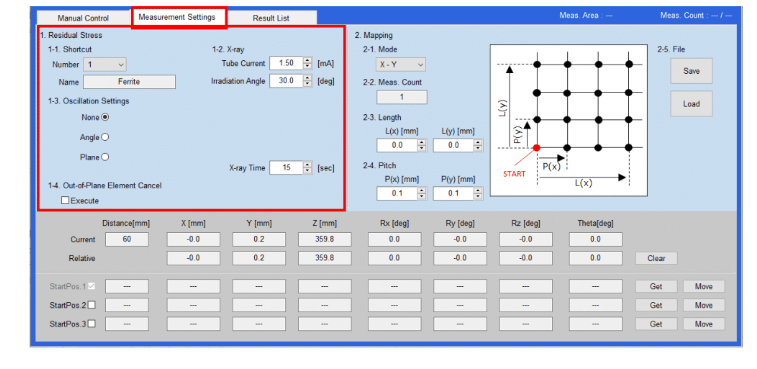
Use the software to fill in the shortcut number and name for the measurement to help you easily find it in the software, choose the sample’s material based on the X-ray tube type, adjust the irradiation angle, verify oscillation settings, and input the X-ray exposure time.
When you’re setting the X-ray exposure time, keep in mind that when ‘Angle’ or ‘Plane’ oscillation is selected, it will populate a recommended exposure time based on the additional oscillation settings, including oscillation patterns, number of round-trips for each axis, and the oscillation width and speed. The displayed time may differ from the actual irradiation time. If you exceed the set exposure time value, you will see the result displayed in red, which means it can’t be measured using that exposure time.
4. Adjust the Position of the Laser Scanner
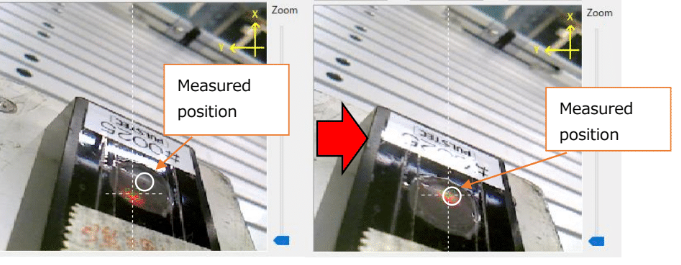
Select ‘Stress Measurement Point’ in the software and click on the ‘Scan Center’ button. When you do this, a new ‘Distance Display’ window will pop up, and the system will emit a laser to the center of the scan area. Change the X and Y coordinates as needed to align the position of the laser to the area of the sample that will be scanned, taking care to ensure the sample and sensor unit don’t touch. Also, adjust the Z-axis so the distance is at least 250 millimeters. If you’re outside the recommended range (200 to 300 millimeters), the display distance will revert to “0.0.”
After making your adjustments, click ‘OK’ to stop the laser and close the ‘Distance Display’ window.
5. Perform a Scan
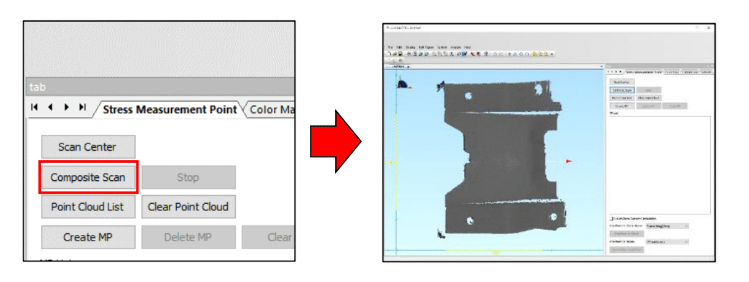
Click the ‘Composite Scan’ button to start scanning. Once the scan is completed, you’ll see the point cloud data displayed in the window. You can use the software to define the path the robot will follow during the scan, including point, line, and area scans, depending on the sample’s geometry. If you’ve added point cloud data, click ‘Composite Scan’ to perform a new scan, then you’ll see the combined point cloud data. You can perform as many scans as needed. In the software, you will see a ‘Point Cloud List’ displaying all the acquired data. You can go through this list and individually show or hide various data.
6. Set the 3D Mapping Measurement Conditions
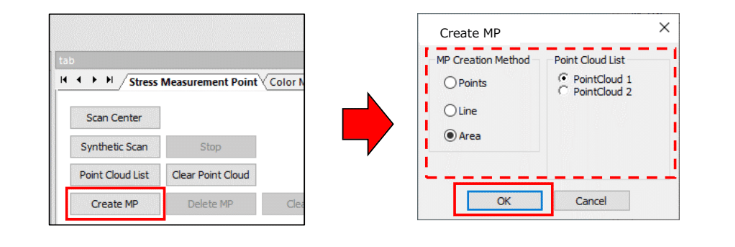
Click on the ‘Create MP’ button and select either ‘Points,’ ‘Line,’ or ‘Area’ as a creation method. With Point, you’re using a measurement point on the point cloud data. Line means that you can choose a start point and end point within the point cloud data, and Area is where you can create two diagonal points on the point cloud data. In this window, you can also view a simulation of the measurement area before you start the measurement. After confirming the measurement area, click ‘OK.’ This information is now saved in the MPList.
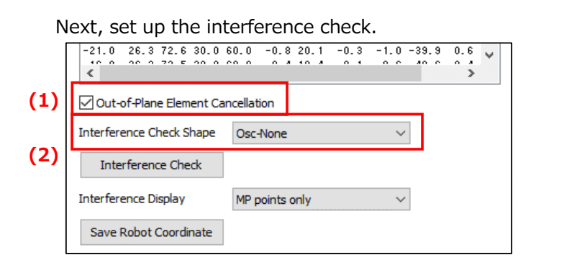
Then, set up the interference check by selecting whether or not you want to include out-of-plane element cancellation in the measurement and setting the sensor shape based on the angle-of-incidence oscillation. If the MPList turns red, this means that these mapping conditions are not available for measurement. If the MPList doesn’t turn red, click ‘Save Robot Coordinate’ to register the information into the software.
To preserve your data, make sure the rotation stage remains still, the shielded box door stays closed, and you don’t switch to ‘TEACH Mode.’ If any of these conditions occur, your data will be automatically cleared from the software.
7. Perform an Operational Test
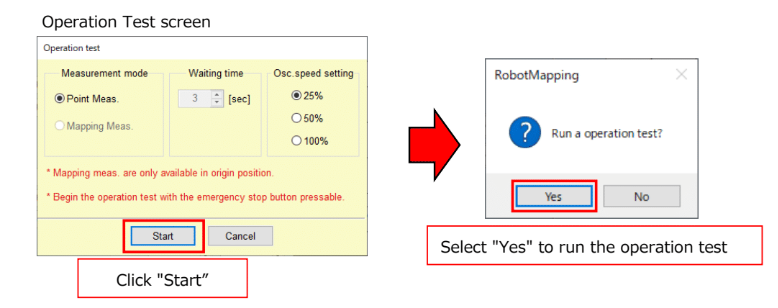
Then, perform an operational test by clicking on ‘Operation Test.’ You should always perform an operational test before the actual measurement to ensure there aren’t any problems with your parameters and that there isn’t a risk of the sample coming into contact with any part of the system. No X-ray irradiation occurs during this test.
8. Perform Your Measurements
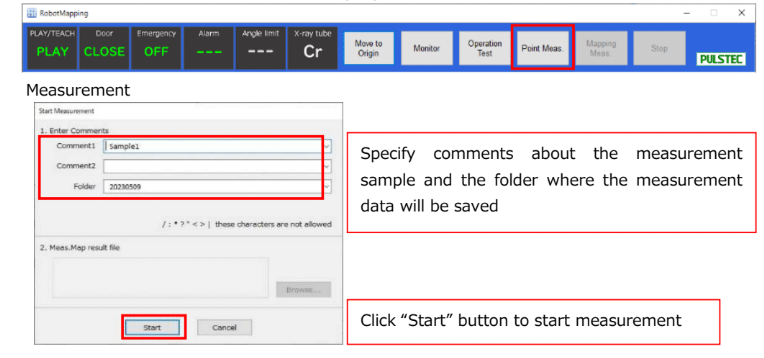
Click the ‘Mapping Measurement’ button and add any information that would be helpful, including details about the sample and where the data will be saved. All results will be exported as a .csv file. Then, click ‘start’ to begin the measurement. At any point, you can press ‘Stop’ to stop the measurements. When the mapping is completed, a box will pop up that says ‘Measurement complete.’
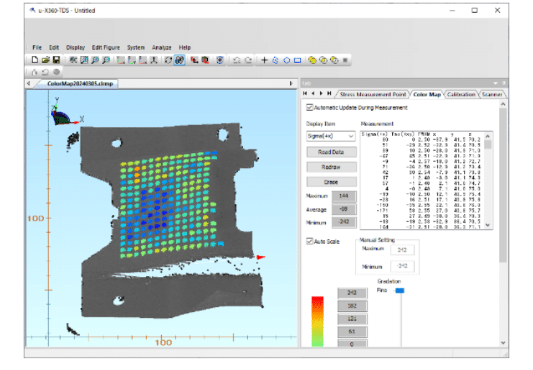
The software will display the map. There will be a chart with data points paired to different colors. Red shows areas of high stress, while blue shows areas of low stress.
Why Should You Choose Our System?
Since our founding over 50 years ago, Pulstec has been committed to engineering innovative products. We were the first company in the world to successfully develop an X-ray residual stress analyzer using the cosα method, which uses a 2D sensor instead of a zero- or one-dimensional sensor, as traditionally used in the sin2𝜓 method of X-ray diffraction. The cosα method is less sensitive to variations in the distance between the X-ray source and the sample. For example, the cosα method has a working distance forgiveness of just a few millimeters, while other methods require ten microns. The cosα method also allows you to view the entire Debye-Scherrer ring instead of just part of it, giving you the opportunity to view more data points for analysis.
Our newer robotic mapping system carries over this technology, allowing you to benefit from highly precise data, better position reproducibility, and intuitive mapping.
Request a Free Demo Today
Please contact us today to learn more about our Robotic Residual Stress Measurement System, or to request a free demo.

