
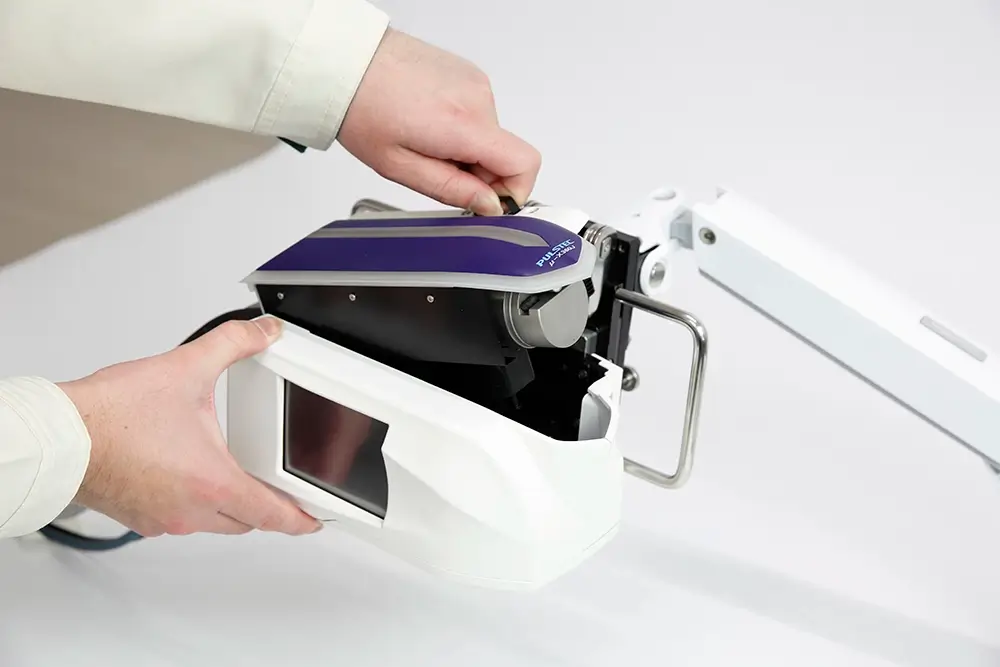
Residual stress can be measured using different destructive and non-destructive methods, but X-ray diffraction remains among the most reliable non-contact techniques.
X-ray diffraction equipment intended for residual stress measurement can be classified as using the traditional sin2ψ method, which uses a zero- or one-dimensional detector to record a portion of the Debye-Scherrer ring, or the newer cosα method, which uses a two-dimensional sensor to acquire the entire ring.
The cosα method is much faster, less complicated, and more practical for on-site and in-situ measuring applications compared to the traditional method, but like sin2ψ, is restricted to surface stress measurements. Depth profiles can be built by repeating the measurement after removing layers (therefore making it destructive), typically via electrochemical polishing, so that no new stress is introduced.
Residual stress measurement is often required after processes like shot peening, grinding, welding, and heat treatments, which can introduce tensile and compressive stresses to the structure. The existence of either stress isn’t inherently bad, but in excess it can lead to premature failures in the final product.
Table of Contents
Elements of a Residual Stress Profile
- Surface Stress: The stress value at zero depth.
- Maximum Stress/Peak & Depth: The highest stress magnitude in the profile, usually compressive, and the depth where it occurs, which may be at the surface or below it, depending on the process and material.
- Crossover Depth: The depth where the stress passes through zero, reported as the depth of the compressive layer.
- Balancing Region: Below the crossover, a lower-magnitude tensile zone extends deeper.
- FWHM Profile: The cosα records a diffraction peak width at each depth. Full Width at Half Maximum (FWHM) tracks cold work, dislocation density, and hardness.
- Uncertainty & Ring Quality: Error bars come from the fit, and spotty or incomplete rings indicate coarse grains or texture.
Shot Peening
Shot peening is a cold working process that’s frequently used to create a layer of compressive stress to improve fatigue strength. When measuring residual stress after shot peening, the resulting profile will appear like a hook.
There is usually a subsurface compressive maximum at roughly 0.05-0.25 mm, and the compressive layer typically extends from about 0.1 to 1mm, depending on shot size and Almen intensity.
The subsurface maximum stress reflects Hertzian contact stresses, and the location of these stresses depends on hardness. Harder materials often peak below the surface, while softer ones peak at the surface. FWHM is highest at the surface and falls to the base-material value at roughly the depth of the compressive layer. Higher intensity deepens the layer but does not raise the peak much.
Grinding
Machine grinding is necessary to produce precision components, but it introduces heat mechanically and can induce tensile residual stress if not controlled. X-ray diffraction can help verify grinding burn alongside nital etch.
Parts that have undergone grinding will typically have shallow, steep profiles, mostly confined to the first 10-100 µm, so fine depth steps near the surface matter. Gentle grinding leaves mild surface compression, but abusive grinding, where heat dominates, leaves surface tension that can approach several hundred MPa, increasing fatigue and cracking risks.
A drop in FWHM near the surface indicates over-tempering, while a sharp rise in a thin layer can indicate rehardened, untempered martensite with an over-tempered zone beneath it.
Welding
Welding benefits from stress mapping because stresses vary more across the weld than with depth. In the fusion zone and heat-affected zone, the longitudinal stress is usually tensile and can approach the material’s yield strength, balanced by compression farther away. Transverse stresses are usually lower. Solid-state phase transformations (austenite to martensite) during cooling can complicate this because they reduce the tension or even make it compressive in some steels. Coarse, textured fusion-zone grains can often produce spotty rings, which the full-ring capture of the cosα method handles better than conventional sin2ψ.
Weld stresses can extend millimeters deep, so X-ray diffraction may need to be combined with deeper-reaching methods, such as hole drilling.
Heat Treatments
Case hardening, quench hardening, and annealing all produce different residual stress profiles. Annealing and stress relief decrease stress magnitudes toward near-zero; FWHM drops toward recovered or recrystallized values, while case hardening often produces compressive stresses through the case, with the maximum typically below the surface and a transition to tension near the case/core boundary.
Interpreting Profiles
Each displayed data point averages over the X-ray penetration depth, so steep gradients right at the surface are smoothed. When interpreting profiles, note whether layer-removal corrections were applied, since uncorrected data from deep profiles on thin parts can be significantly off. Comparing the stress and FWHM profiles together is also recommended to better understand what a process did, especially after thermal exposure.
Learn More From Pulstec
Founded in 1969, Pulstec engineers X-ray diffraction equipment used to measure residual stress, retained austenite, surface hardness variation, single crystal orientation, and more. Visit our blog for more residual stress resources.